The downward trends are steeper at rural sites than at urban and road sites. The report is available here.
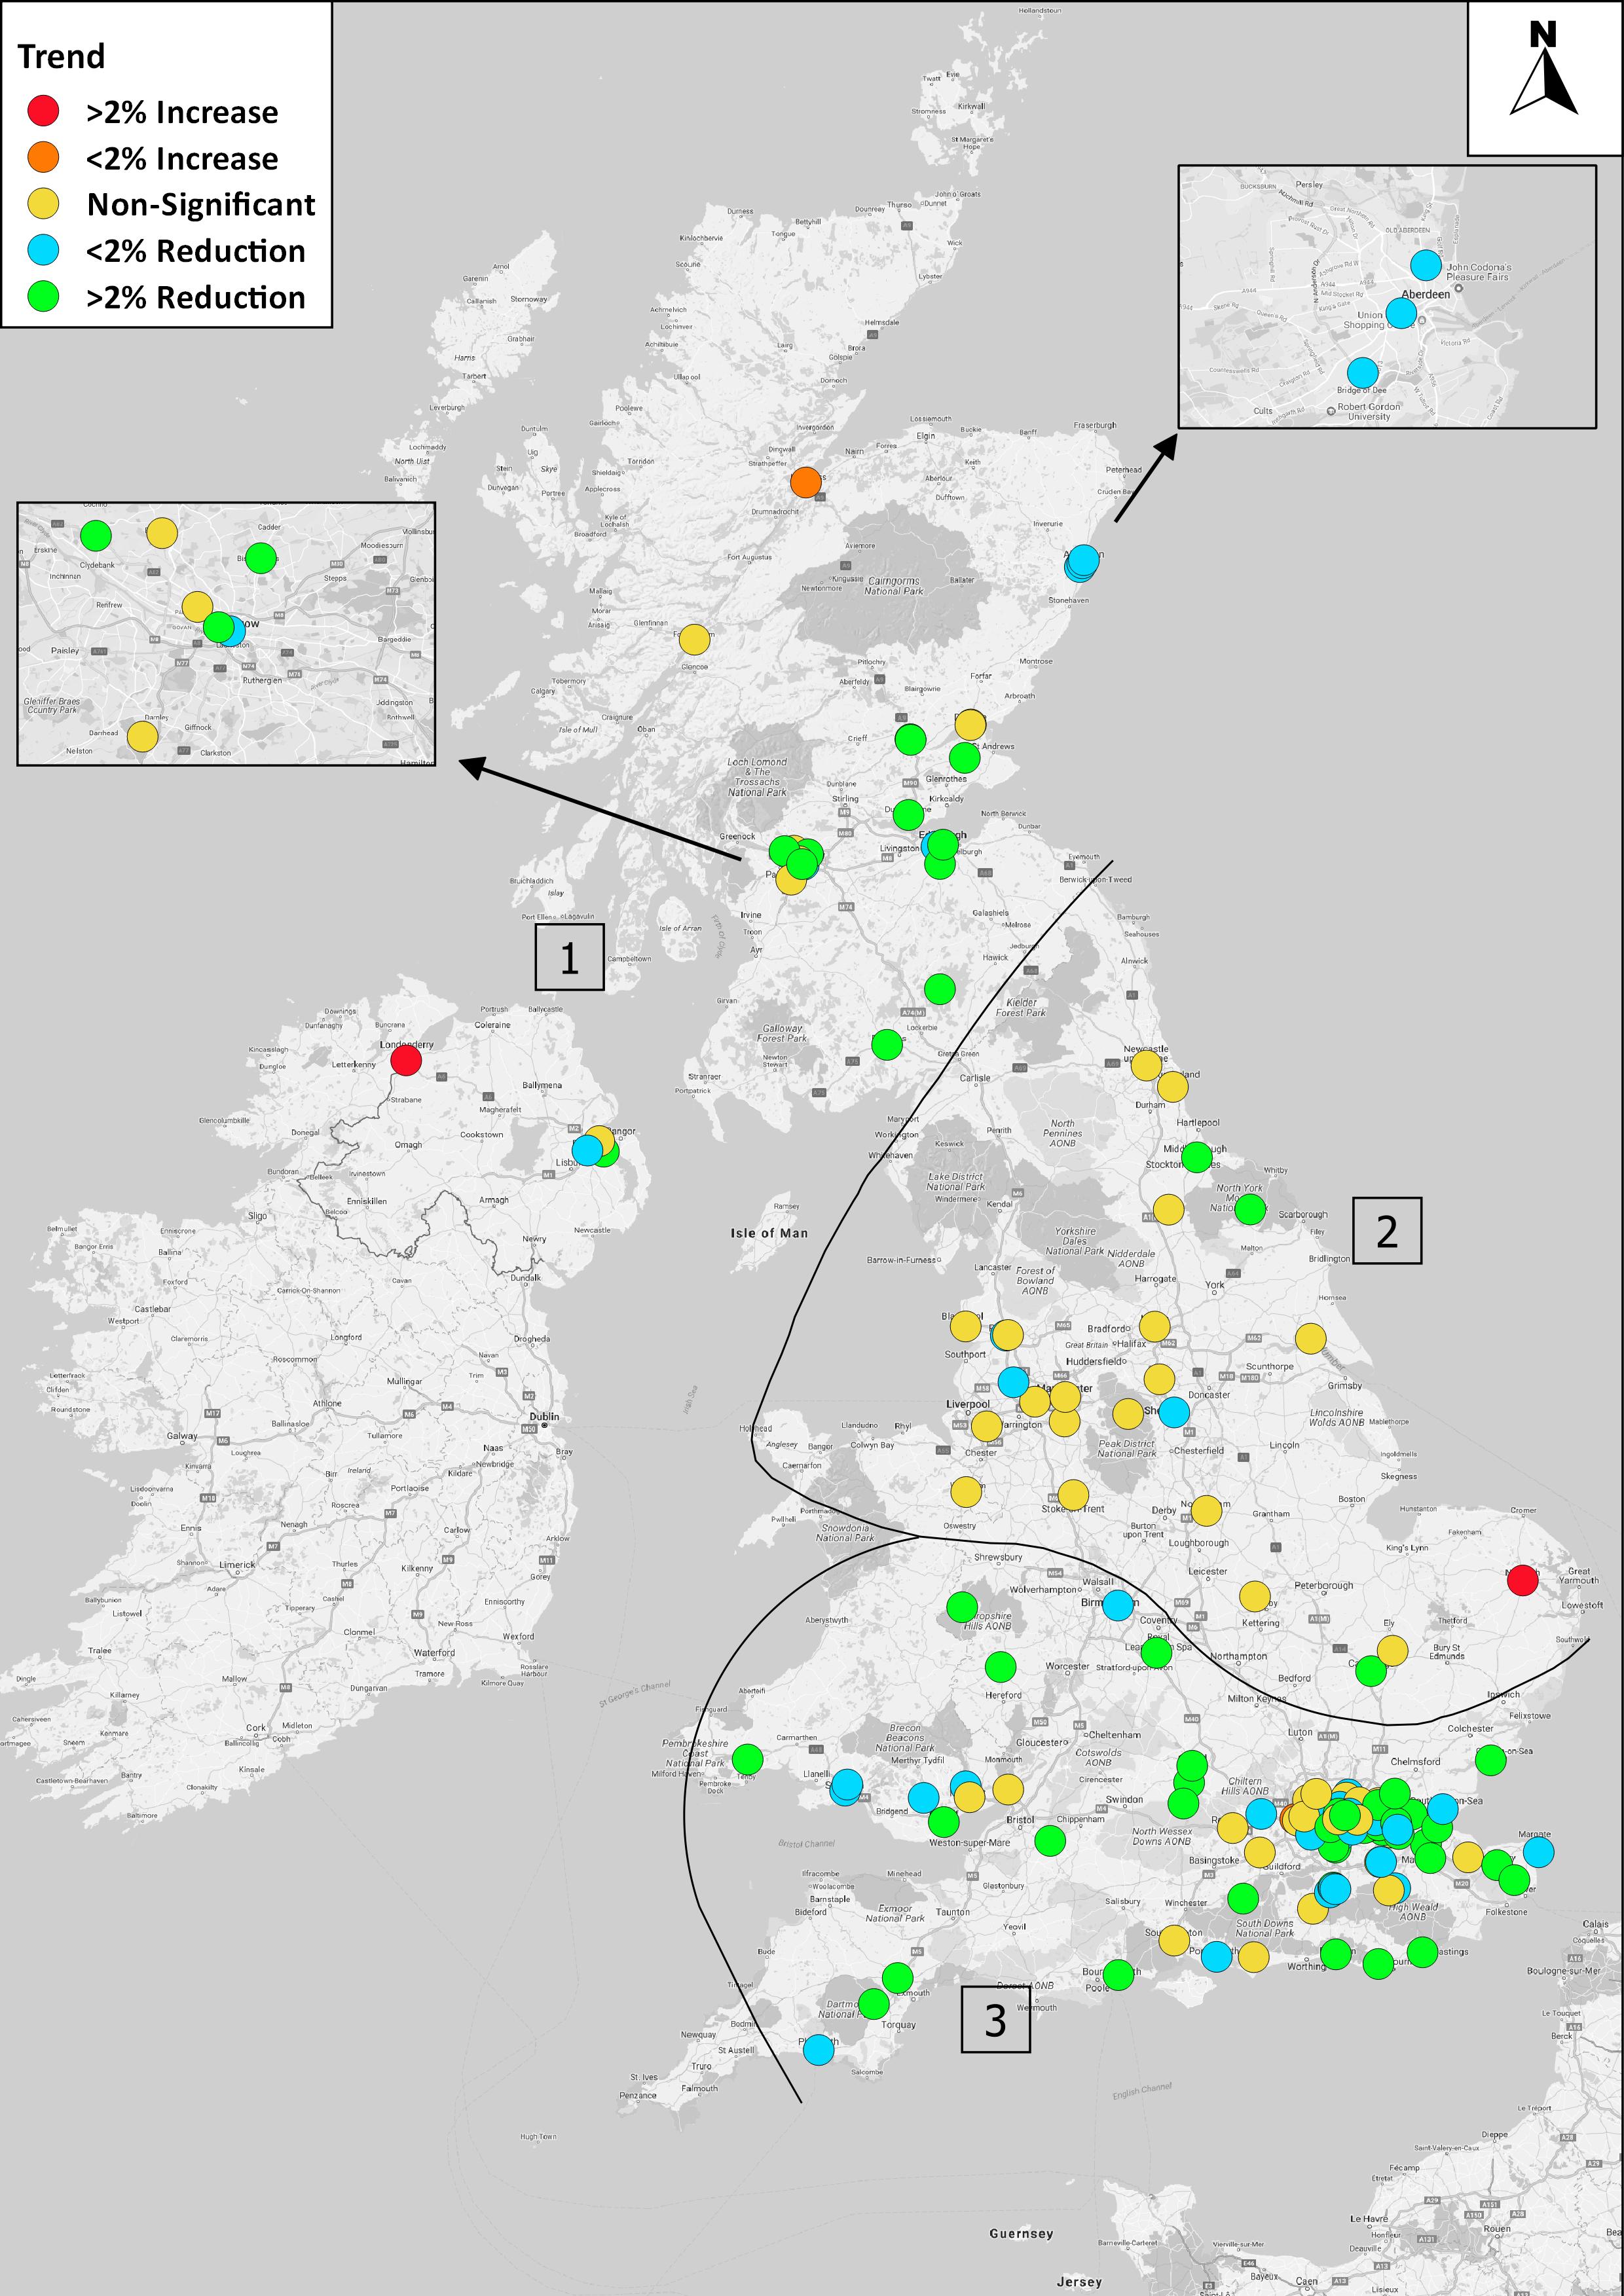
While the trend is downward overall, this is not seen at all sites. Around a third of sites show no significant trend, with around 3% to 4% having an upward trend. Importantly, no significant average trend in either NO2 or NOx has been found across sites in Central and Northern England and North Wales (the map below shows the NO2 results). The reason for this is unclear, but may be significant for air quality management in these areas.

View all news